Senior Cello Recital


Tomorrow, Saturday, December 1st, at 5:00pm, I will be accompanying a cellist for his senior recital at Recital Hall. We've put a lot of work into the program, and we think it'll be a great show! (Actually, it has to be, or we don't get paid.) In any case, the music is guaranteed to entertain, enliven, edify, etiolate, and shock the listener; and we hope that you enjoy it as much as we've enjoyed putting it together!

What: Senior Cello Recital, featuring the music of Bach, Debussy, Respighi, and Schumann
Where: Recital Hall, Jacobs School of Music (1201 E. 3rd Street)
Who: Ryan Fitzpatrick (cello), Andrew Jahn & Wendelen Kwek (piano)

Link to the Facebook invite can be found here; we're working on getting up a livestream, which will be posted as soon as it's available.

Manual Talairach Normalization in AFNI

Back in olden times, before the invention of modern devices such as computers and slap bracelets, brain researchers relied on standard coordinate systems as a guide to brain anatomy. One of the most enduringly popular of these was the Talairach coordinate system, based on the brain of a deceased elderly Frenchwoman; the origin of this space was located at the anterior commissure, and both the anterior and posterior commissures were then set on an even plane. Other brains could then be similarly oriented, warped, squashed, stretched, and subject to varied forms of torture and abuse until they roughly matched the Frenchwoman's.

These days, we have computer algorithms to do that for us; and although all of the leading FMRI packages have tools to perform these transformations automatically, there are still ways to do it by hand with AFNI. The following tutorial video shows you how to do it in excruciating detail, including how to locate the AC/PC line with ease, how to find the mysterious "Define Markers" button, and why the Big Talairach Box should be checked - no matter what.

Experience the way they used to do it, either out of a desire for nostalgia or masochism. The video is rather long (I try to keep them bite-sized, delicious, and under five minutes), but long procedures require long demonstrations; if nothing else, you may find the nascent stirrings of intimacy you begin to experience with your data a satisfying surrogate for the painful void of intimacy in your own life.


SPM: Setting the Origin and Normalization (Feat. Chad)

Of all the preprocessing steps in FMRI data, normalization is most susceptible to errors, failure, mistakes, madness, and demonic possession. This step involves the application of warps (just another term for transformations) of your anatomical and functional datasets in order to match a standardized space; in other words, all of your images will be squarely placed within a bounding box that has the same dimensions for each image, and each image will be oriented similarly.

To visualize this, imagine that you have twenty individual shoes - possibly, those single shoes you find discarded along the highways of America - each corresponding to an individual anatomical image. You also have a shoe box, corresponding to the standardized space, or template. Now, some of the shoes are big, some are small, and some have bizarre contours which prevent their fitting comfortably in the box.

However, due to a perverted Procrustean desire, you want all of those shoes to fit inside the box exactly; each shoe should have the toe and heel just touching the front and back of the box, and the sides of the shoes should barely graze the cardboard. If a particular shoe does not fit these requirements, you make it fit; excess length is hacked off*, while smaller footwear is stretched to the boundaries; extra rubber on the soles is either filed down or padded, until the shoe fits inside the box perfectly; and the resulting shoes, while bearing little similarity to their original shape, will all be roughly the same size.

This, in a nutshell, is what happens during normalization. However, it can easily fail and lead to wonky-looking normalized brains, usually with abnormal skewing of a particular dimension. This can often by explained by a faulty starting location, which can then lead to getting trapped in what is called a local minimum.

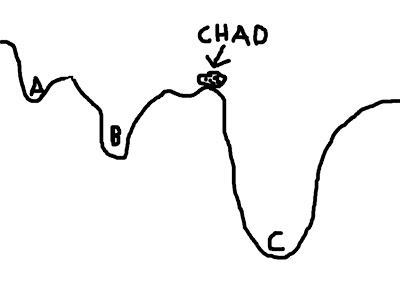
To visualize this concept, imagine a boulder rolling down valleys. The lowest point that the boulder can fall into represents the best solution; the boulder - named Chad - is happiest when he is at the lowest point he can find. However, there are several dips and dells and dales and swales that Chad can roll into, and if he doesn't search around far enough, he may imagine himself to be in the lowest place in the valley - even if that is not necessarily the case. In the picture below, let's say that Chad starts between points A and B; if he looks at the two options, he chooses B, since it is lower, and Chad is therefore happier. However, Chad, in his shortsightedness, has failed to look beyond those two options and descry option C, which in truth is the lowest point of all the valleys.


This represents a faulty starting position; and although Chad could extend the range of his search, the range of his gaze, and behold all of the options underneath the pandemonium of the dying sun, this would take far longer. Think of this as corresponding to the search space; expanding this space requires more computing time, which is undesirable.

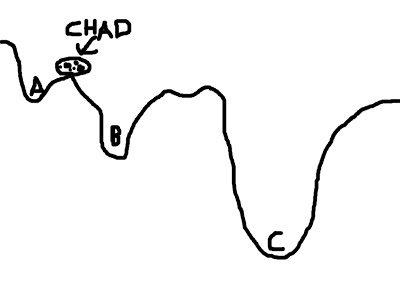
To mitigate this problem, we can give Chad a hand by placing him in a location where he is more likely to find the optimal solution. For example, let us place Chad closer to C - conceivably, even within C itself - and he will find it much easier to roll his rotund, rocky little body into the soft, warm, womb-like crater of option C, and thus obtain a boulder's beggar's bliss.

(For the mathematically inclined, the contours of the valley represent the cost function; the boulder represents the cost function ratio between the source image and the template image; and each letter (A, B, and C) represents a possible minimum in the cost function.)


As with Chad, so with your anatomical images. It is well for the neuroimager to know that the origin (i.e., coordinates 0,0,0) of both Talairach and MNI space is roughly located at the anterior commissure of the brain; therefore, it behooves you to set the origins of your anatomical images to the anterior commissure as well. The following tutorial will show you how to do this in SPM, where this technique is most important:


Once we have successfully warped our anatomical image to a template space, the reason for coregistration becomes apparent: Since our T2-weighted functional images were in roughly the same space as the anatomical image, we can apply the same warps used on the anatomical image to the functional images. This is where the "Other Images" option comes into play in the SPM interface.


As always, check your registration. Then, check it again. Then, ask someone else to check it. (This is a great way to meet girls.) In particular, check to make sure that the internal structures (such as the ventricles) are properly aligned between the template image and your warped images; matching the internal variability of the template image is much trickier, and therefore much more susceptible to failure - even if the outer boundaries of the brain look as though they match up.


*Actually, it's more accurate to say that it is compressed. However, once I started with the Procrustean thing, I just had to roll with it.
 

Stats Videos (Why do you divide samples by n-1?)

Because FMRI analysis requires a strong statistical background, I've added a couple videos going over the basics of statistical inference, and I use both R and Excel to show the output of certain procedures. In this demo, I go over why the sums of squares of sample populations are divided by n-1; a concept not covered in many statistical textbooks, but an important topic for understanding both statistical inference and where degrees of freedom come from. This isn't a rigorous proof, just a demonstration of why dividing by n-1 is a unbiased estimation of sample variance.


Cello Unchained: Public Recital


Tomorrow at Boxcar Books in Bloomington, there will be a public studio recital featuring cellists from the Jacobs School of Music. The pieces range from virtuosic showpieces (such as the Popper etudes) to lyrical songs without words, and I will be accompanying several of them. So if you're in the area, feel free to stop by!

Boxcar Books Recital  

When: Monday, November 26th, at 7:00pm
Where: Boxcar Books, 408 E 6th St (right next to Runcible Spoon)
Who: The entire cello studio of Emilio Colón
Link to Facebook invite


Coregistration Demonstrations

Coregistration - the alignment of two separate modalities, such as T1-weighted and T2-weighted images - is an important precursor to normalization. This is because 1) It aligns both the anatomical and functional images into the same space and orientation; and 2) Because any warps applied to the anatomical image can then be accurately applied to the functional images as well. You can create a homemade demonstration of this yourself, using nothing more than a deck of playing cards, a lemon, and a belt.


However, before doing either coregistration or normalization, often it is useful to manually set the coordinates of the anatomical image (or whichever image you will be warping to a standardized space) so that it is in as close an alignment with the template image as possible. Since the origins of both MNI and Talairach standardized spaces are located approximately at the anterior commissure, the origin of the anatomical image should be placed there as well; this provides a better starting point for the normalization process, and increases the likelihood of success. The following tutorial shows you how to do this, as well as what the anterior commissure looks like.


Once this is done, you are ready to proceed with the coregistration step. Usually the average EPI image - output from the realignment step - will be used as the source image, while the anatomical image will be used as the reference image (the image that is moved around). Then, these warps are applied to the functional images to bring everything into harmonious alignment.


Let's Talk about Masks (Live Video)

I've been experimenting more with Camtasia, and I've uploaded a new video showing how masks are drawn on an actual human, rubber brain, which involves the use of R studio, Excel, and colored pens. My hope is that this makes the learning experience more interactive; in addition, you get to see what my mug looks like.


FSL Tutorial: Featquery_gui

Now that we've created our masks, we can go ahead and extract data using FSL's featquery tool. You may want to run it from the command line when batching large numbers of subjects, but this tutorial will focus on Featquery_gui, a graphical interface for loading subjects and ROIs, and then performing data extraction from that ROI. The procedure is similar to Marsbar, and I hope that the video is clear on how to do this.

Also, I've attached a Black Dynamite video for your enjoyment. Nothing to do with ROIs, really, but we all need a break now and then.


A Note about FMRI Masks


Now that we have covered how to create masks using three separate software packages - FSL, SPM, and AFNI - I should probably take a step back and talk about what masks are all about. When I first read about masks, all I heard was a bunch of mumbo jumbo about zeros and ones, and unhelpful saran wrap metaphors. While this did remind me to purchase valuable kitchen supplies, it was unhelpful in understanding what a mask was, exactly, and how it was used.

Simply put, a mask is a subset of voxels you wish to analyze. Let's say I'm only interested in the right hemisphere of the brain; to create a mask of the right hemisphere, imagine using a papercutter to split the brain in half, and only taking the right hemisphere for further analysis, while discarding the left hemisphere into the trash can. The generation of masks follows this same logic - only focus on a specific part of the brain, and discard the rest.

Fortunately, we have come a long way since using office supplies to create masks, and now we have computers to do it for us. In order to create a mask using any of the listed software packages, usually you will use a tool to insert "1's" into the voxels that you wish to analyze, and "0's" everywhere else. Then, say that you want to do an ROI analysis only on those voxels that contain "1's". If you are trying to extract contrast estimates for a subject, the contrast estimate at each voxel will be multiplied by the mask, and you will be left with the contrast estimates in the "1's" voxels (since each estimate is being multiplied by 1), and zeros everywhere else.

Furthermore, ROI extraction within a mask often averages the contrast (or parameter) estimates across all of the voxels inside the mask. It is also possible to extract estimates from single voxels or a single triplet of coordinates - just think of this as ROI analysis of a very small mask.

I hope that this clarifies things a bit; I know that it took me a couple of years to wrap my head around the whole concept of masks and ROIs and severing hemispheres from each other. However, once you understand this, the whole process of ROI interrogation becomes much simpler and more intuitive, and analyses become easier to carry out. ROI analysis is the foundation for carrying out more complex analyses, such as double dissociations and connectivity analyses, and it is well to become familiar with this before tackling larger game.

Creating Masks In FSL

Due to a high number of requests (three), I have made some walkthroughs about how to create masks in FSL. There are a few different ways to do this:

  1. Anatomical ROI: These masks are generated from anatomical regions labeled by atlases. For example, you may decide to focus only on voxels within the V1 area of visual cortex. Using an atlas will create a mask of that region, based on the atlas-defined anatomical boundaries in a standardized space.
  2. Functional ROI (or contrast ROI): This is a mask created from a contrast thresholded at a specific statistic value. For example, you may wish to focus only on voxels that pass cluster correction for the contrast of left button presses minus right button presses.
  3. Painting ROIs: This is where the real fun starts; instead of being confined by the limitations of anatomical or contrast boundaries, let your imagination run wild and simply paint where you want to do an ROI analysis. Similar to what you did in first grade, but more high-tech and with less puking after eating your crayons. (Is it my fault that Razzmatazz Red sounds so delicious?)
Demonstrations of each approach can be found in the following videos:

 Anatomical ROIs

Functional ROIs

 ROIs created from FSLview. Pretend like you're Bob Ross.