
Five years ago, during the UCLA Neuroimaging Training Program, I first learned how to do multi-voxel pattern analysis, or MVPA. There were a few different tools that we could choose from, and I remember that one of them called The Decoding Toolbox seemed quick, intuitive, and easy to use. At the time I was looking for new software packages to promote, and The Decoding Toolbox seemed like an excellent candidate; too many students, myself included, would get bogged down with other packages that had a steep learning curve, seemingly unapproachable if you didn’t already have a strong background in how to do the analysis. What was needed was a “shallow ramp” for beginners; a package that could get them started, and which they could also use for more advanced analyses, too.
In any case, it’s finished now after several years, and both the veteran and the newcomer can enjoy the pleasures of MVPA. The walkthrough, which can be found here on the e-book, starts with a general overview of multivariate analysis, and how it came to be applied to fMRI data. Instead of focusing just on differences in activation between conditions, MVPA will look at the entire pattern of activity distributed across any region that you like - whether it is the whole brain, or a mask that focuses on a particular subset of voxels.

Example of a pattern of BOLD activity in an fMRI image. Imagine that this image was collected while the subject was doing a stop-signal task, which requires cognitive control. Instead of focusing on the entire brain we could instead focus on a specific region of the brain, such as this 2x2 grid of voxels; and furthermore, instead of averaging the signal of these voxels, we could instead use it as a pattern to train a classifier. If there are enough instances where this general pattern of activity is elicited in response to a cognitive control condition - not just an absolute amount of signal, but rather the relative amount of signal between voxels - then we could claim that cognitive control is encoded as a pattern within this region.
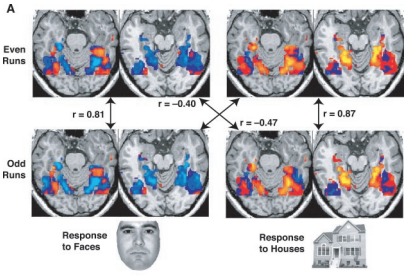
The reader is then introduced to the study that first applied MVPA to fMRI data - the experiment by Haxby et al., 2001. The details are probably familiar to most, with the search for patterns of brain activity that were specific to different categories: Faces, houses, scissors, and others. This dataset is first analyzed using AFNI’s 3dsvm, a command created by Stephen LaConte shortly after the Haxby paper was published; in case the reader is more familiar with AFNI, or doesn’t have access to Matlab, this will do more or less the same thing.
For those who do have Matlab, however, the benefits of The Decoding Toolbox are enticing. For the beginner, images are generated which build his intuition about which voxels are being used for classification, and how the models are generated using a leave-one-out cross-validation procedure. Whether he uses an ROI approach or a whole-brain searchlight analysis, the classification voxels are highlighted - and, in the case of the searchlight analysis, the search is updated every few seconds or so, to illustrate how the analysis is continually updated.
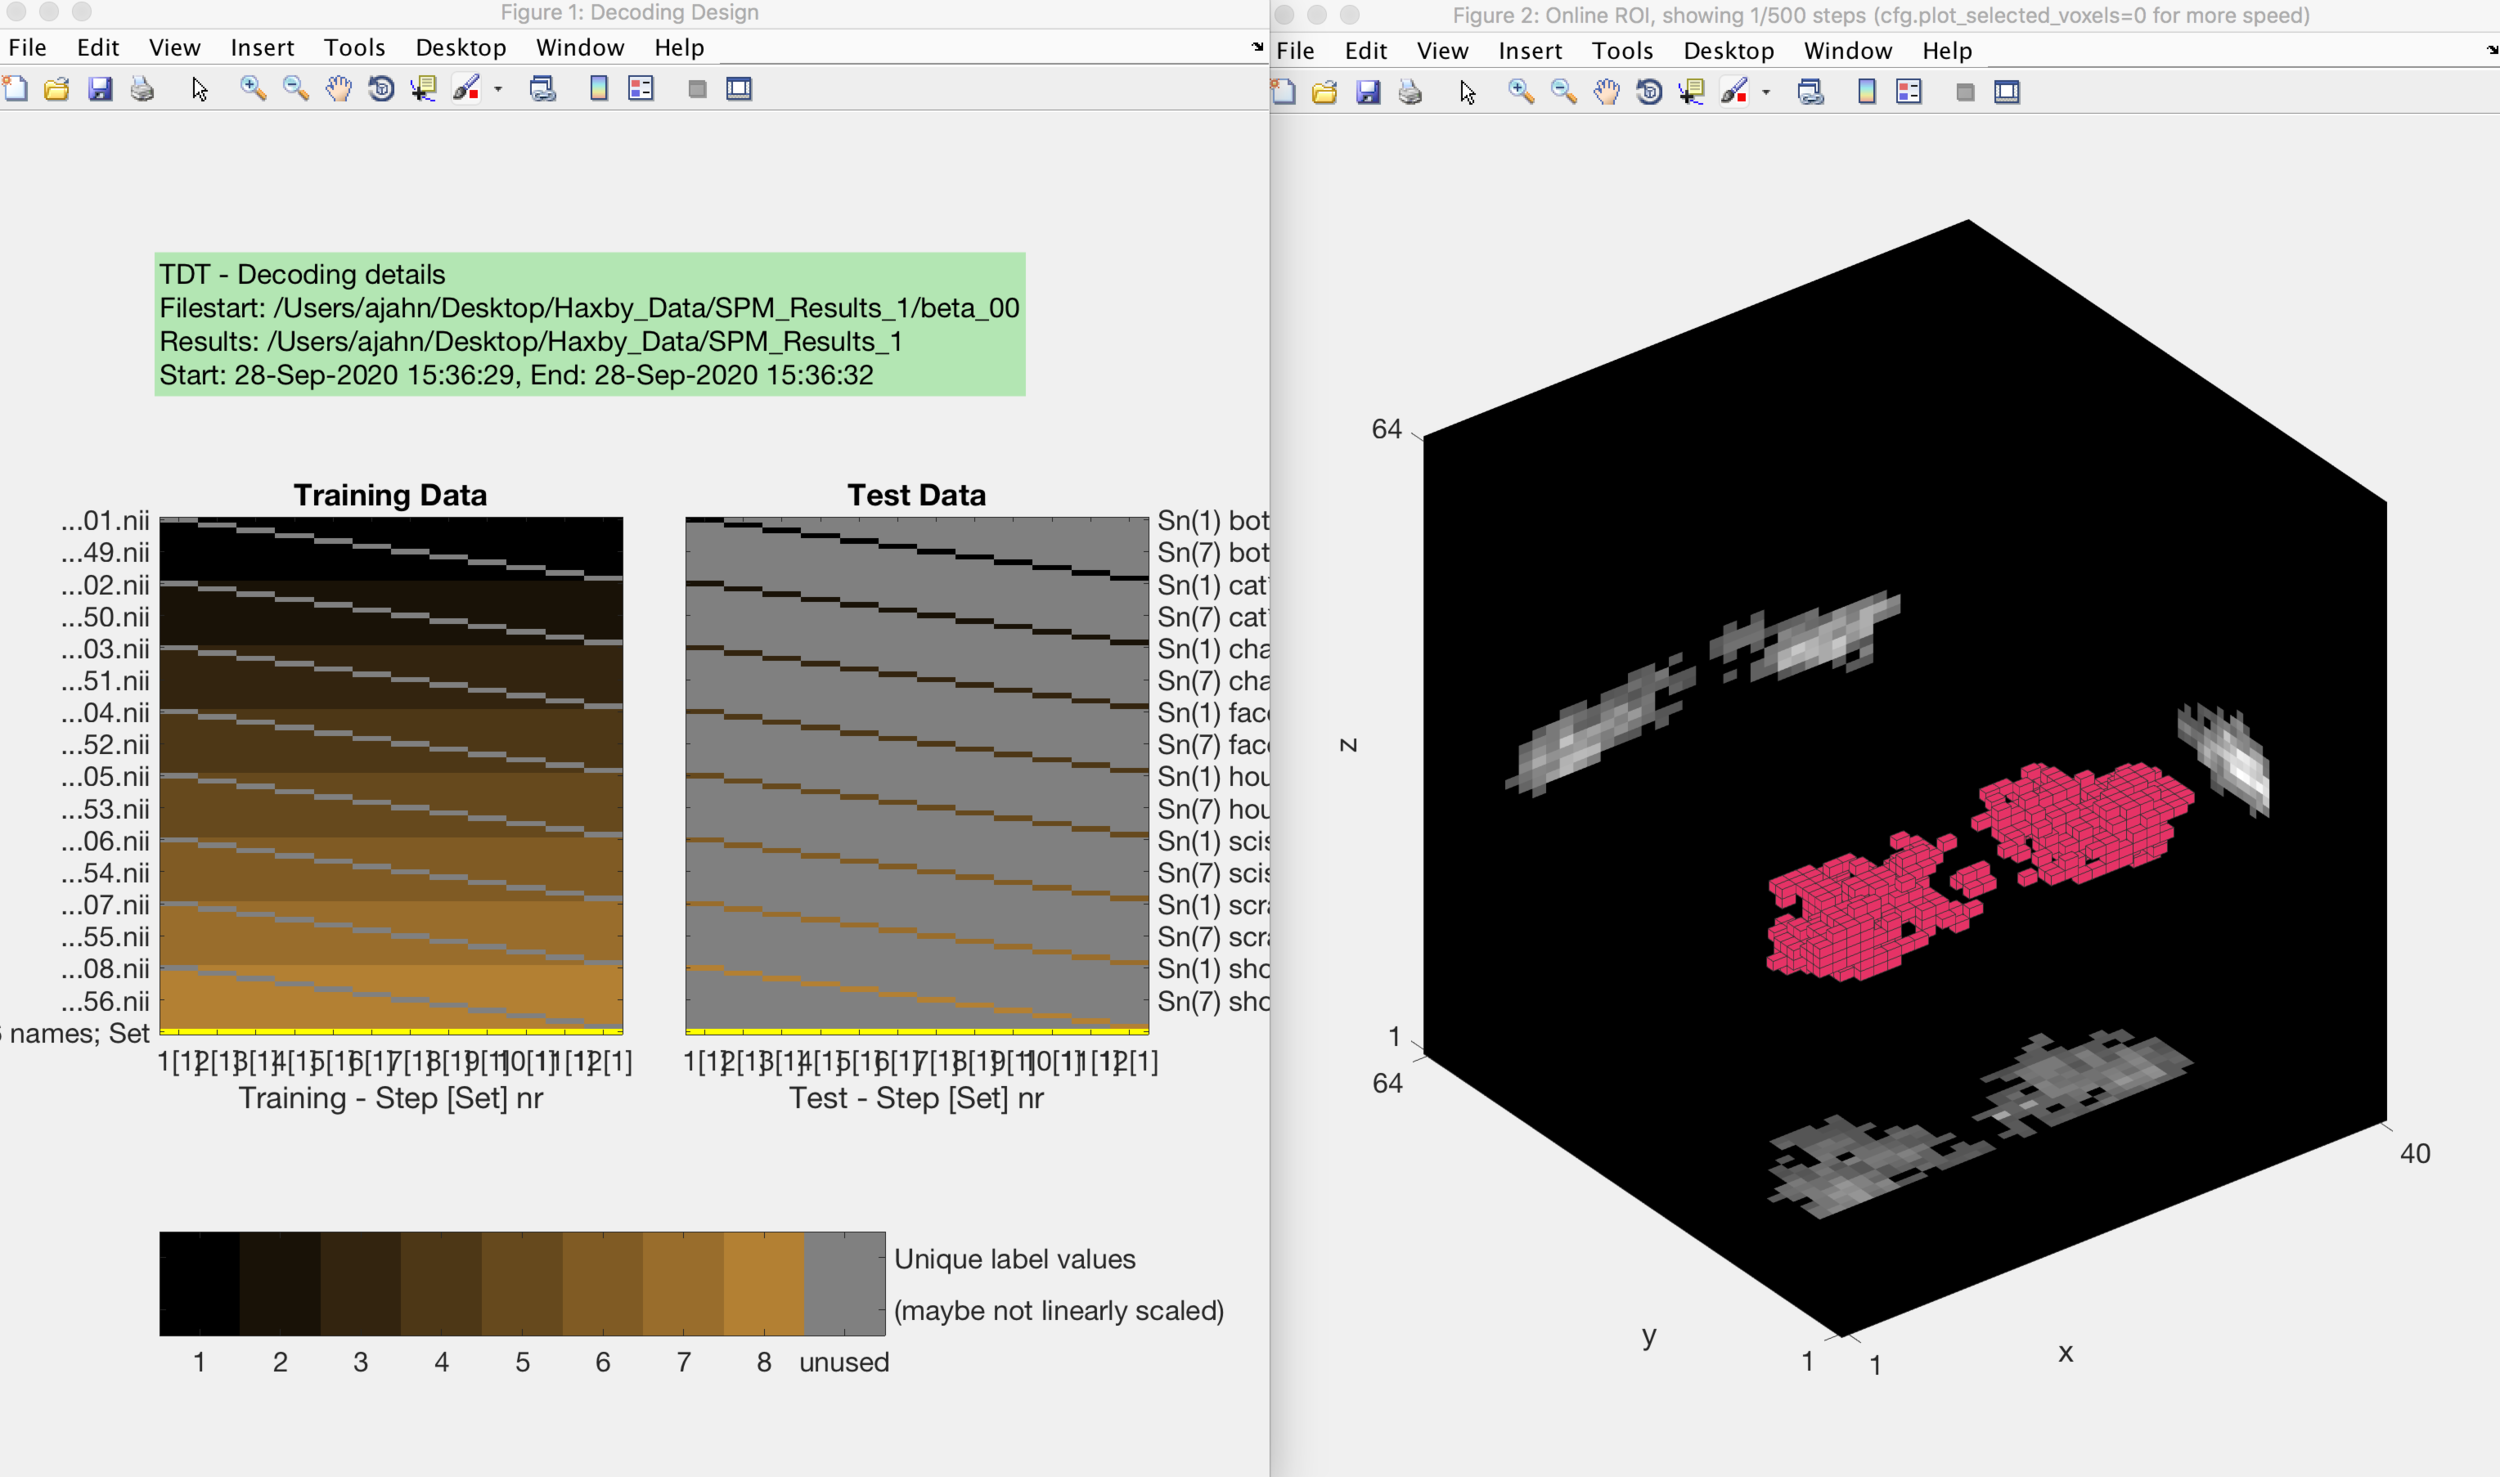
The output from an MVPA ROI analysis. The figure on the left shows the beta maps that are used as both training and testing data, which uses a leave-one-out cross-validation procedure. The figure on the right shows a three-dimensional representation of the voxels in the mask.
The output of these analyses is either a confusion matrix showing the classification accuracy for each condition (for the ROI analysis, for example), or an accuracy map for the whole brain as a result of a searchlight analysis.

Left Panel: A whole-brain classification accuracy map as a result of a searchlight analysis. Right Panel: A confusion matrix representing the classification accuracy for each condition.
Lastly, the reader will learn how to script these analyses and run group-level inference. As of now, I am still working on a section for Prevalence Inference, a technique that Allefeld et al. (2016) have demonstrated is more appropriate for classification data than a t-test or even non-parametric methods. I also have plans to include more advanced analyses that The Decoding Toolbox is also capable of, such as Representational Similarity Analysis. Until then, if you want to learn the basics of MVPA and replicate the results of a famous experiment, you can begin here.